- AAVE trading price has seen a repulse of 2.4% in the last 24 hours.
- The token is down from its all-time high by 91.75%.
- The token has been recently listed on linear finance.
The price of AAVE has fallen immensely after getting rejected from $88. The current price is trading very near the support level of $50. If we get a successful retest from the support we can achieve almost 40% of profit by reaching the level of $70.
The token marked its all-time high on 19th May 2021 when the token was priced at $666.86. The token is currently trading with a decrease in volume by 3.41% in the last 24 hours.
- The token has a current market cap of $79.84M.
- The token has a circulating supply of 14,534,962 AAVE which is 90.84% of its total supply.
- The 24-hour trading volume of the token is $4.35M.
The month of September 2023 is very eventful for the AAVE token. There are 5 events for the token this month. You can check the information about upcoming events of the token at coinmarketcal.com
On 19th Sep 2023, It has a real-world asset summit. Which is a major event for the token.
SENTIMENT ANALYSIS

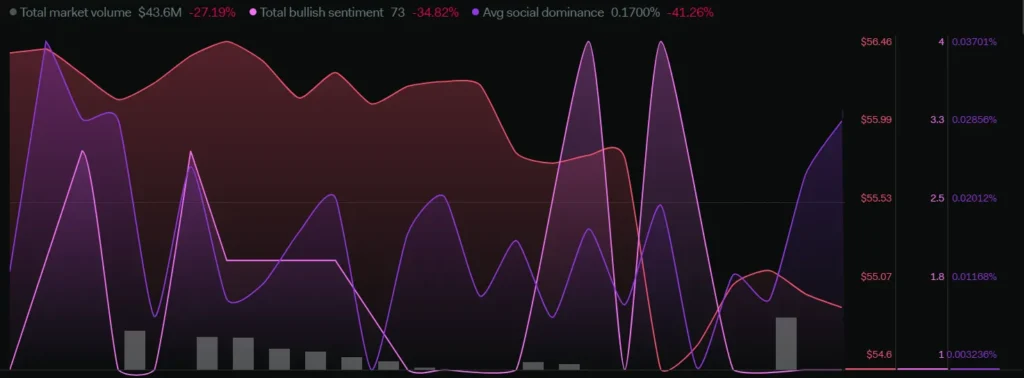
The total market volume of the token has fallen by 27.19 % which shows currently there is no mark of bullish investors in the market. The total bullish sentiments have decreased by 34.82% as the price keeps on falling. The average social dominance has declined by 41.26% which shows that the community is not so actively engaging. The daily scenario of the token remains bearish until we take support from the $50 range.
The bullish sentiments have increased in the monthly time frame as the total bullish sentiments have surged by 123% and the average social dominance has increased by 31.89%. The token is bullish in the long-term time frame.
TECHNICAL ANALYSIS (WEEKLY – 7D)

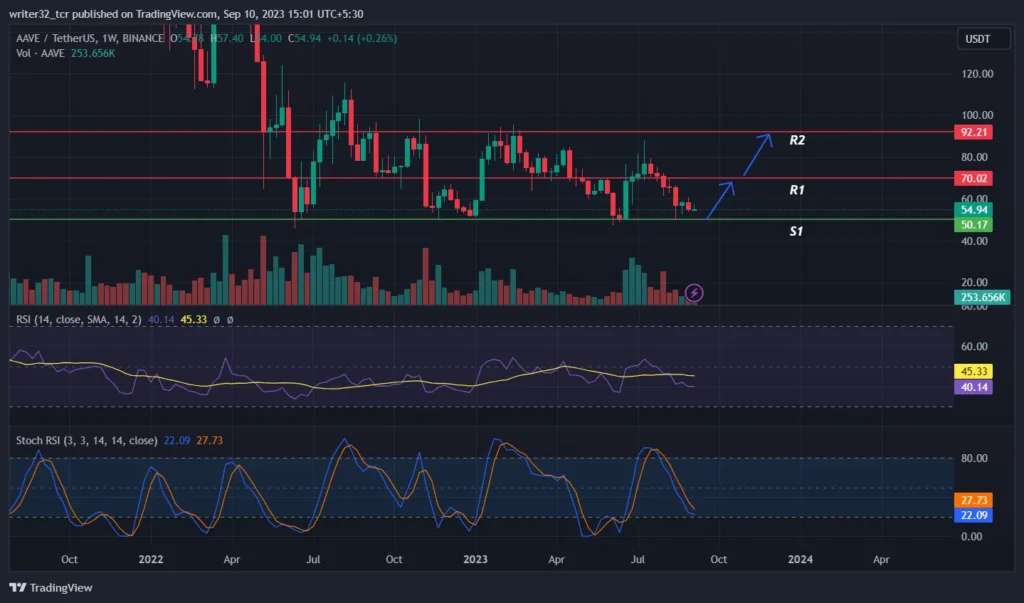
As we can see in the chart, The price gets a major decline from the $92 resistance but last time the last time price got rejected from the $88 range. The price after getting rejected from $92 falls every time to the $50 range and a bounces from there again to move upwards. The price tried to break the $92 resistance 4 times.
The price is currently approaching the support of $50 and is likely to bounce from that level and start an upward move. To reach $100 in 202, The price has to break the resistance of $92 which is very important if we have to reach the $100 range.
The RSI is moving at 40.14 points and the SMA 14 is at 45.33 points. It means that the RSI is under neutral level 50 and also under the oversold region. Which is showing a bearish side until we test the support.
The Stoch RSI is showing levels just like the results similar to RSI, stating towards almost in the oversold region.
CONCLUSION
After confirming the trends, sentiments, and analysis. The investors can wait for the trend confirmation for the bullish price. A proper bounce can be confirmed after retesting the support. A breakdown below the $50 support can continue a further bearish move in the price.
TECHNICAL LEVELS
- SUPPORT: $50
- RESISTANCE: $70 AND $92
Disclaimer
The views and opinions stated by the author, or any people named in this article, are for informational purposes only and do not establish financial, investment, or other advice. Investing in or trading crypto assets comes with a risk of financial loss.


