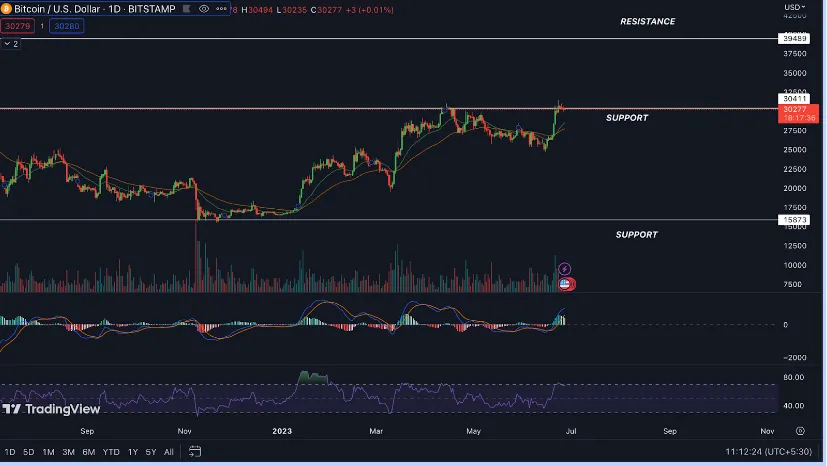
- Bitcoin (BTC) is currently trading at $30342 with a rise of 0.045% in 24 hours.
- Bitcoin (BTC)’s live market cap is $589,866,603,547.
- Bitcoin (BTC)’s 24-hour volume is $15,269,181,471 which rose by 15.36% in 24 hours.
Bitcoin is a decentralized digital currency that was developed in 2008 by an unidentified person or group of people using the alias Satoshi Nakamoto. It was made available as open-source software in 2009, and since then, it has become the first and best-known cryptocurrency.
Bitcoin operates on a peer-to-peer network without the need for a middleman or centralized authority. The blockchain is a decentralized public ledger where transactions are stored and encrypted by nodes for verification. Transparency and transaction security are provided by this technology.
Bitcoin Price Trend Analysis
The price of Bitcoin has been wildly erratic recently. When considering its long-term growth, it has seen a tremendous price increase since its creation. Throughout the years, there have been a number of boom and bust cycles for it, with periods of sharp price increases followed by sizeable price declines. The long-term trends have generally been positive. The price of BTC has increased by 29.25% over the past nine days, showing that it is currently outperforming. In less than a year and a half, Bitcoin (BTC) has increased to $69,000. It has decreased by -76.90% since then.
Bitcoin (BTC) Price Analysis

EMA
In the daily time frame, BTC is currently trading above the 20-day and 50-day exponential moving averages, signifying a bullish trend. is the subject of bullish momentum and buy-side investor sentiment.
MACD
The MACD line for Bitcoin in the daily period is now above the signal line, based on the most recent data. At 581 and 993, respectively, the signal and MACD lines are both above the zero line. This bullish crossing indicates that short-term buying pressure may prevail over selling pressure. It suggests that Bitcoin might be increasing.
Volume Analysis
The 24-hour trading volume for BTC is $15,269,181,471, an increase of 15.36%, indicating a rise in market activity, which indicates that buyers are active.
Conclusion
In conclusion, a daily analysis of the MACD and EMA indicates that BTC is currently displaying positive signs. While the EMA is below the price and the MACD indicates buying pressure, the crossover of 20 to 50 denotes a successful advance. Traders and investors should do more research, take other factors into consideration, and use risk management techniques before making any investment decisions.
Technical Levels
Support – The current support level of Bitcoin (BTC) is $30411.
Resistance -The current resistance level of Bitcoin (BTC) is $39489.
Disclaimer
The thoughts and opinions expressed by the author or anyone else named in this article are solely for informational purposes. They don’t offer any advice of any kind, be it financial, investment, or otherwise. The possibility of losing money exists when buying, selling, or investing in cryptocurrencies.


