 Analysis and Prediction")
The Render Network (RNDR) links creators who need more processing power to render their scenes to suppliers who are paid in RNDR Tokens for their GPU resources. It makes the transactional workflow of rendering and streaming 3D environments, models, and objects for end users simpler by enabling complex GPU-based render jobs to be distributed and processed across a peer-to-peer (P2P) network.
Jules Urbach, CEO of OTOY Inc., a Los Angeles-based tech business that specializes in GPU-based software solutions, first had the idea for the RNDR Network. The organization was established with the intention of utilizing blockchain technology to expand the use of GPUs globally for uses other than proof of work (PoW) for other blockchains.
In 2017, the initial coin offering (ICO) ran from October 6 to October 12. 4,650,922 RNDR Tokens were sold in total throughout that time at a cost of $0.25 each. The team predicted in March 2018 that there would be 536,870,912 issued tokens overall in the ecosystem. The contract migration process started with a 1:1 migration ratio between old and new contracts.
The Previous Intentions of Token
The current price of Render Token is $ 1.736263, with a 24-hour trading volume of $ 57.65M, a market cap of $ 641.75M, and a market dominance of 0.05%. The price of RNDR has risen by 2.82% in the previous 24 hours.
Render Token had its greatest price on November 21, 2021, when it traded at its all-time high of $8.77, and its lowest price was recorded on September 22, 2020, when it traded at its all-time low of $0.000115. The lowest price since the all-time high was $ 0.277999 (cycle low). Since the last cycle low, the highest RNDR price was $2.89 (cycle high). The price forecast attitude for Render Token is now neutral, with the Fear and Greed Index reading 50 (Neutral).
The current circulating supply of Render Token is 369.61 million RNDR, with a maximum supply of 536.87 million RNDR. The current annual supply inflation rate is 45.63%, implying that 115.82 million RNDR were generated in the previous year. Render Token is presently rated #21 in the Ethereum (ERC20) Tokens category and #3 in the AI Crypto sector by market capitalization.
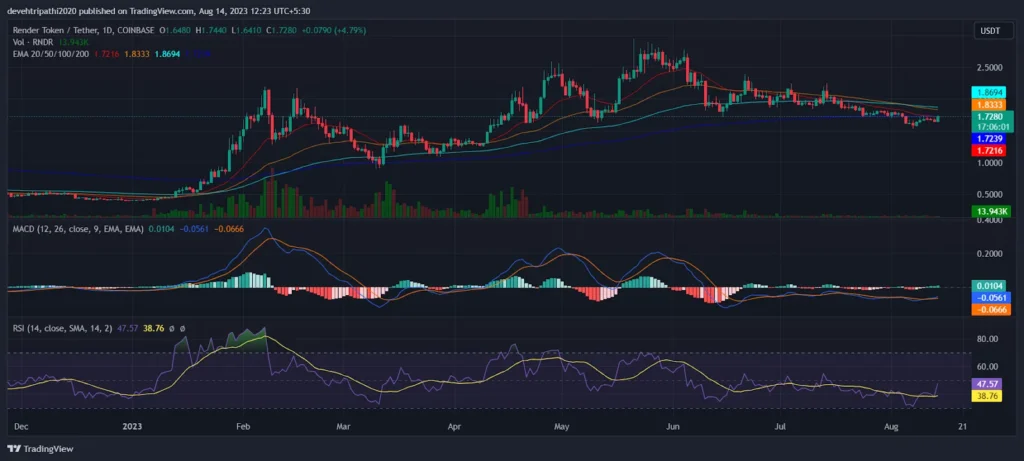
Analyzing the token from the TradingView
Render prices are presently in a short-term adjustment phase following an almost 90% increase from January 2023 to May 2023. Profit was booked as a result of the short-term price increase. Profiteers led by investors halted the momentum, and the price fell to start a correction phase.
The price is currently in a corrective phase, moving lower and being rejected by an upper trendline. The cryptocurrency had a trading volume of $13.93 Million, down 16.87% in the last 24 hours. The current volume-to-market capitalization ratio is 4.26, indicating modest volatility.
The RNDR price remains neutral to negative in the short term as it trades below the upper trendline barrier. According to analysts, the price failed to persist above the 200 EMA on the daily chart, indicating market weakness at present.
The long-term prognosis remains neutral as long as the price remains above the prior breakout zone. MACD lines have crossed bullishly. However, histogram bars are forming above the mean line, indicating a neutral to positive market attitude.
According to the EMA Analysis, the RNDR price failed to sustain above the 200 EMA, indicating a short-term decline.
The RSI value of the RNDR coin is 43.30 at the time of publication, while the SMA line is 38.37. The RSI has broken over the SMA line, indicating that the price will likely rise in the next few days.
On the daily chart:
- The Moving average convergence Divergence (MACD) indicator for Rand Mining Limited (RND) is 0.01, indicating that Rand Mining Limited is a Sell.
- With a 20-day Exponential Moving Average of 1.22 and a share price of AU$1.23 for Rand Mining Limited (RND), it is recommended that you buy.
- With a 50-day exponential moving average of 1.24 and a share price of AU$1.23 for Rand Mining Limited (RND), the stock is considered a Sell.
Indicators:
- The Trend Strength Indicator (ADX) for Rand Mining Limited (RND) is 37.54, indicating a Neutral trend.
- The Commodity Channel Index (CCI) for Rand Mining Limited (RND) is -86.71, producing a Neutral signal.
- The Price Rate of Change (ROC) for Rand Mining Limited (RND) is -7.52, indicating a Sale.
- With a 10-day exponential moving average of 1.24 and a share price of AU$1.23 for Rand Mining Limited (RND), the stock is considered a Sell.
The Coming momentum of the Token
By July 25, 2023, the price of Render Token is expected to fall by -7.32% and hit $1.758562, according to our most recent price projection. Our technical indicators indicate that the current mood is Neutral, while the Fear and Greed Index reading is 56 (Greed). Over the past 30 days, Render Token has experienced 4.51% price volatility, with 14/30 (47%) green days. It’s an excellent moment to acquire Render Token right now based on our Render Token forecast.
Currently, the forecast for the price of a Render Token in 2025 ranges from $3.71 on the low end to $14.99 on the high end. If RNDR hits the higher price target, Render Token might increase in value by 676.22% by 2025 in comparison to its current pricing.
Currently, the projected price range for Render Tokens in 2030 is from $10.84 on the low end to $13.72 on the high end. If Render Token hits the higher price target by 2030, it might increase in value from its current price by 610.81%.
Conclusion
Render prices are presently in a short-term adjustment phase following an almost 90% increase from January 2023 to May 2023. Profit was booked as a result of the short-term price increase. Profiteers led by investors halted the momentum, and the price fell to start a correction phase.
Technical levels
- Resistance levels: 2.84 and 2.5
- Support levels: 0.94
Disclaimer
The views and opinions stated by the author, or any people named in this article, are for informational purposes only. They do not establish financial, investment, or other advice. Investing in or trading crypto assets comes with a risk of financial loss.