
 has been on an upward trend.)
- Berkshire Hathaway’s stock price is trading above 20, 50, and 100-day EMA.
- Berkshire Hathaway’s stock price is currently trading at $342.0.
- Berkshire Hathaway (BRK.B)’s live market cap is $733.71 billion.
A careful review of the stock’s price movement indicates that Berkshire Hathaway (BRK.B) has been on an upward trend. With the current price only 5% below that historic high, the price movement shows a reasonable chance of setting new all-time highs. Notably, the stock just broke out of a well-defined triangle pattern, signaling hope for continuous upward momentum and a potential increase toward the next
resistance level, which is situated near $360.
When looking at historical price data, keep in mind that the BRK.B reached an all-time high of $363 in March 2020. The price did, however, suffer a later round of modification, resulting in a significant fall of over 28% to $258. However, it is worth noting that the stock found firm support there, indicating a shift in the price trend.
Berkshire Hathaway’s stock has resumed its upward trajectory since September 2022, contributing to the firm’s overall bullishness. As of right now, the stock is still displaying great momentum, generating optimism for a prolonged trend till it reaches the next key barrier. We foresee a significant upward surge in the event of a successful break of current resistance.
Berkshire Hathaway (BRK.B) Stock Price Analysis
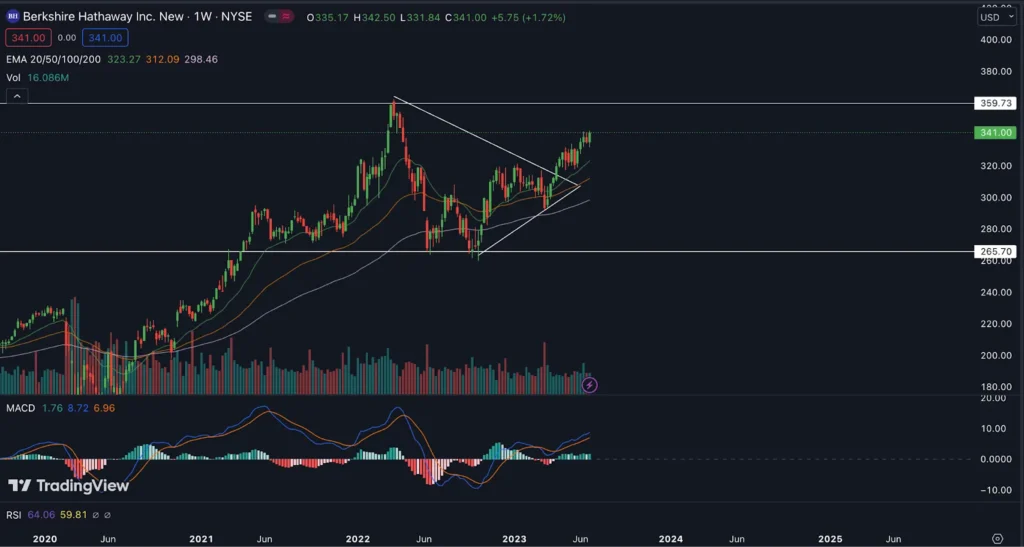
When looking at the price chart, it is clear that the 20, 50, and 100-day Exponential Moving Averages (EMA) for Berkshire Hathaway shares are all below the current price level. This combination is a strong indicator of the likelihood of a future price increase.
The MACD line and the signal line are both above the zero line, and the MACD indicator has a green histogram. This alignment suggests a high velocity, which may imply that the market is rising.
The volume on the chart is also steadily increasing, indicating increased market activity. This increase in volume indicates that customers are joining the market at cheaper costs, lending credence to the concept that a price hike is on the way.
Conclusion
In the end, Berkshire Hathaway is now showing evidence of upward momentum, with indicators favoring further upward movement and an overall good market structure. It is expected that the price will approach, if not exceed, its prior all-time high.
Technical Levels:
- Support – $265.70.
- Resistance -$359.73.
Disclaimer
The views and opinions of the author, or anyone named in this article, are for informational purposes only. They do not offer financial, investment, or other advice. Investing or trading crypto assets involves the risk of financial loss