
XRP dips below the $1.30 support amid bearish positioning
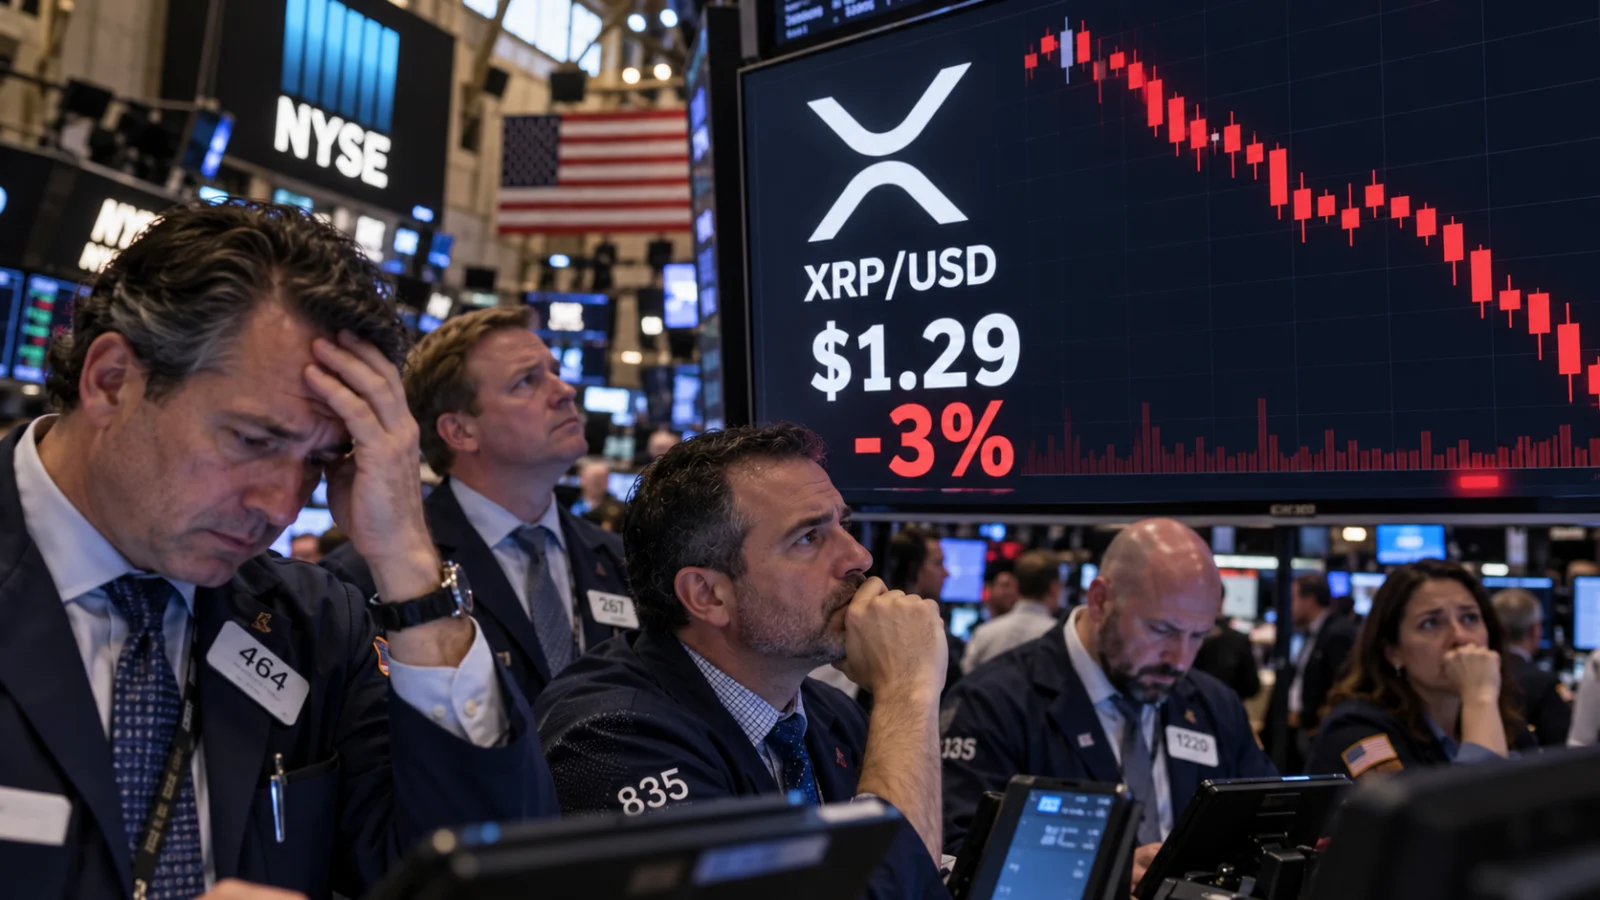
XRP dipped below the crucial $1.30 support level on Thursday, weighed down by persistent selling activity, bearish derivatives positioning, and caution following the Federal Reserve's decision to hold interest rates steady.

Key takeaways
- XRP slipped below $1.30 on Thursday as the ongoing bearish trend continued.
- The long-to-short ratio sits at 0.82, highlighting prevailing bearish positioning within the monitored data.
- To strengthen its near-term technical outlook, XRP must break back through the resistance zone ranging from $1.333 to $1.372.
XRP struggles after Fed’s cautious hold
XRP stayed under pressure on Thursday because negative derivatives positioning and ongoing selling activity kept a lid on any recovery efforts.
Trading near $1.29, XRP dipped below the closely watched $1.300 support mark. This downward movement followed the Federal Reserve’s choice to keep interest rates steady at 3.75%–4.00%.
Even though borrowing costs stayed unchanged, lingering inflation worries alongside a hawkish tone dampened enthusiasm for risk assets.
CoinGlass metrics place XRP’s long-to-short ratio at 0.82, bringing it close to its lowest point in over a month.
When ratios fall below one, short positions outnumber long positions in the gathered dataset, underscoring cautious sentiment surrounding the assets.
On the other hand, funding rates tell a slightly different story for each coin. XRP recorded a funding rate of 0.0036%, holding in positive territory after climbing on October 16.
This positive rate indicates that investors holding long positions are paying those with short positions, pointing to ongoing interest in leveraged bullish bets despite the lower long-to-short ratio.
These conflicting metrics yield mixed signals from the derivatives market, though bears clearly maintain the upper hand at present.
Summary indicators from CryptoQuant point to sell-side dominance across both spot and futures markets for XRP.
Regarding XRP, the platform also highlights substantial whale orders and an overheated market environment. While large orders alone do not clarify whether major investors are buying or selling, the accompanying selling imbalance supports the subdued forecast.
Similarly, spot and futures markets for XLM indicate that sellers still hold the upper hand, implying that its recent bounce lacks sufficient demand to back a bigger rally.
XRP could record further losses as it drops below the $1.300 support
The daily chart for XRP/USD maintains a bearish outlook now that the token has fallen under the horizontal floor close to $1.300.
If a daily candle closes underneath that threshold, it will undermine the current trading range and elevate the probability of a more substantial pullback.
Sitting at 40, the daily Relative Strength Index rests beneath the neutral 50 threshold, signaling that purchasing momentum continues to be weak.
Meanwhile, the Moving Average Convergence Divergence indicator has edged up into positive territory. This supplies an early hint that bearish momentum is letting up, though the price still trades below its major moving averages.
The initial hurdle on the upside for XRP is the 100-day Exponential Moving Average positioned around $1.333. Further up, the 50-day EMA at $1.357 and the 200-day EMA at $1.372 create additional resistance levels.
Overcoming this resistance cluster would offer more solid proof that buyers are starting to take charge again. Additional barriers are located at $1.540 and $1.900, though both sit far above the current market price.
At this stage, hovering just above support leaves XRP with very little buffer against fresh selling pressure. Defending the $1.300 level and breaking through nearby moving averages are the critical hurdles for achieving a lasting recovery.
Frequently Asked Questions
Why did XRP drop below $1.30?
XRP fell below the $1.30 support level due to persistent selling activity, bearish derivatives positioning, and a broader caution in risk assets following the Federal Reserve’s decision to hold interest rates steady.
What does a long-to-short ratio of 0.82 mean for XRP?
A long-to-short ratio of 0.82 indicates that short positions outnumber long positions in the tracked data, reflecting cautious or bearish positioning among traders.
What are the key resistance levels XRP needs to reclaim?
To improve its near-term technical outlook and signal that buyers are regaining control, XRP needs to break through resistance between the 100-day EMA at $1.333, the 50-day EMA at $1.357, and the 200-day EMA at $1.372.


Comments 0 responses